Hey there,
It’s Robin from CFD Engine & I’m back with a super-specific little ParaView tip. Something that might come in handy for a quick job check or for monitoring convergence. It’s particularly useful on remote machines &/or if you’re allergic to gnuplot.
Here it is:
You can read OpenFOAM monitor (.dat) files directly into ParaView using the Tecplot Table reader 🤫
I’m talking about plotting the output from functionObjects like forceCoeffs or surfaceFieldValue – i.e. tabulated scalar data. The kind of info that’s handy to take a quick peak at while a simulation is running or as a visual convergence check after the fact.
I usually use it on remote machines, where I’ll bring up a client-server ParaView & have a quick check – most definitely not watching convergence, no way, not me.
You could do the same thing in gnuplot – but it’s nice to have options, especially if they don’t require Googling the (gnuplot) commands that I forgot, again.
How-To
Let’s take the output of a pressure monitor made using patchAverage via surfaceFieldValue as our example.
We’ll get a data file written to:
$FOAM_CASE/postProcessing/patchAverage/0/surfaceFieldValue.dat
filled with our lovely tabulated data, looking something like this:
 1# Region type   : patch interesting_patch
 2# Faces         : 35270
 3# Area          : 2.073571e-02
 4# Scale factor  : 1.000000e+00
 5# Time          areaAverage (p)
 61               -4.886327e+02
 72               -2.723123e+02
 83               -2.016925e+02
 94               -1.828221e+02
105               -1.873723e+02
11...
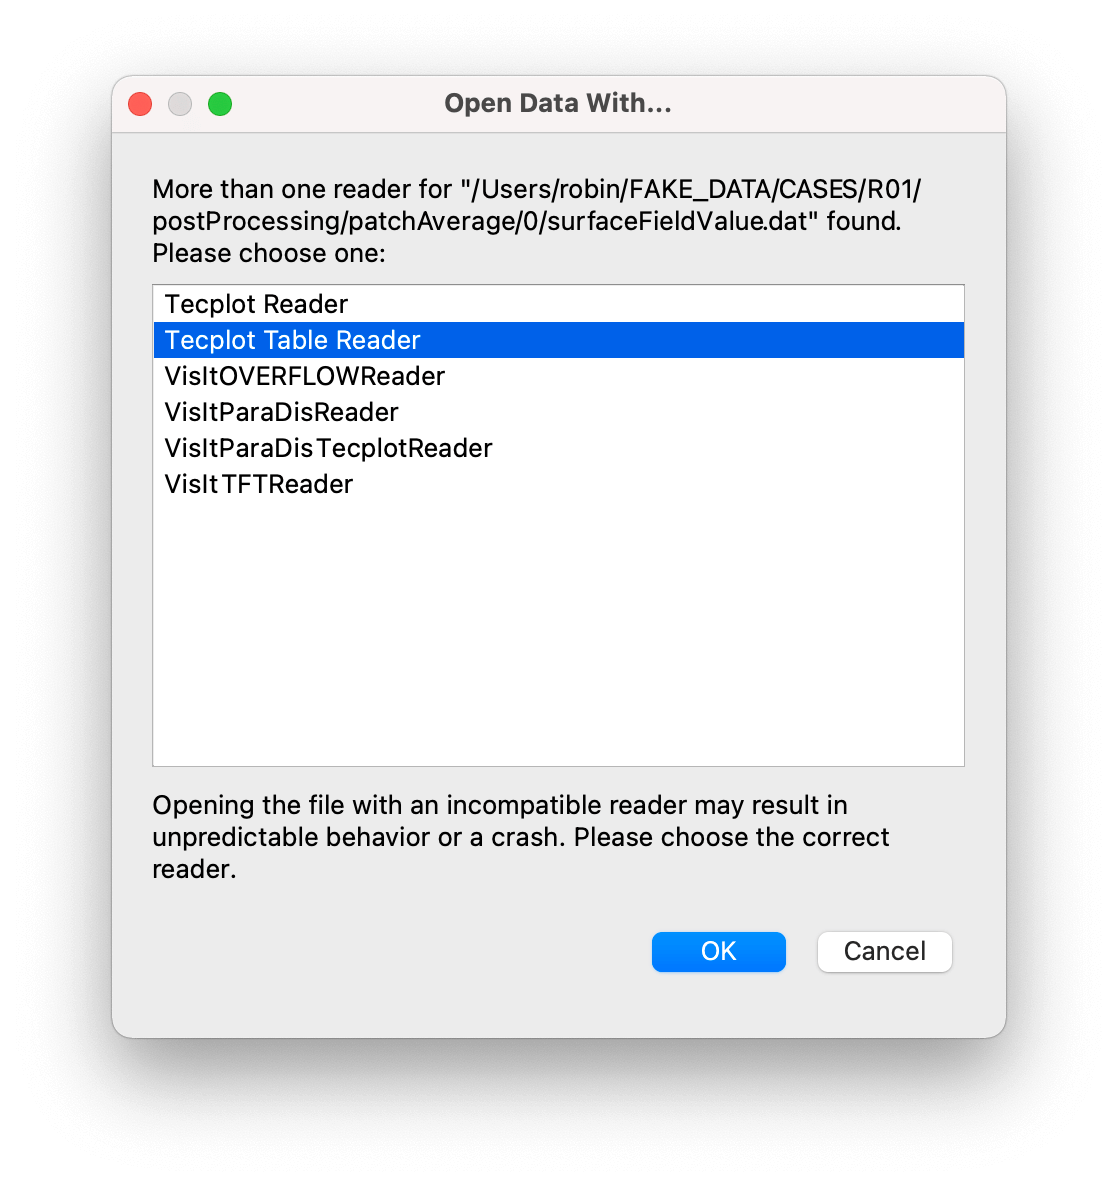
If you open that file directly in ParaView it won’t quite know what to do with it & ask you to choose your preferred reader:

Choose Tecplot Table Reader, click OK & then we’ll need to give it some info about our input file.
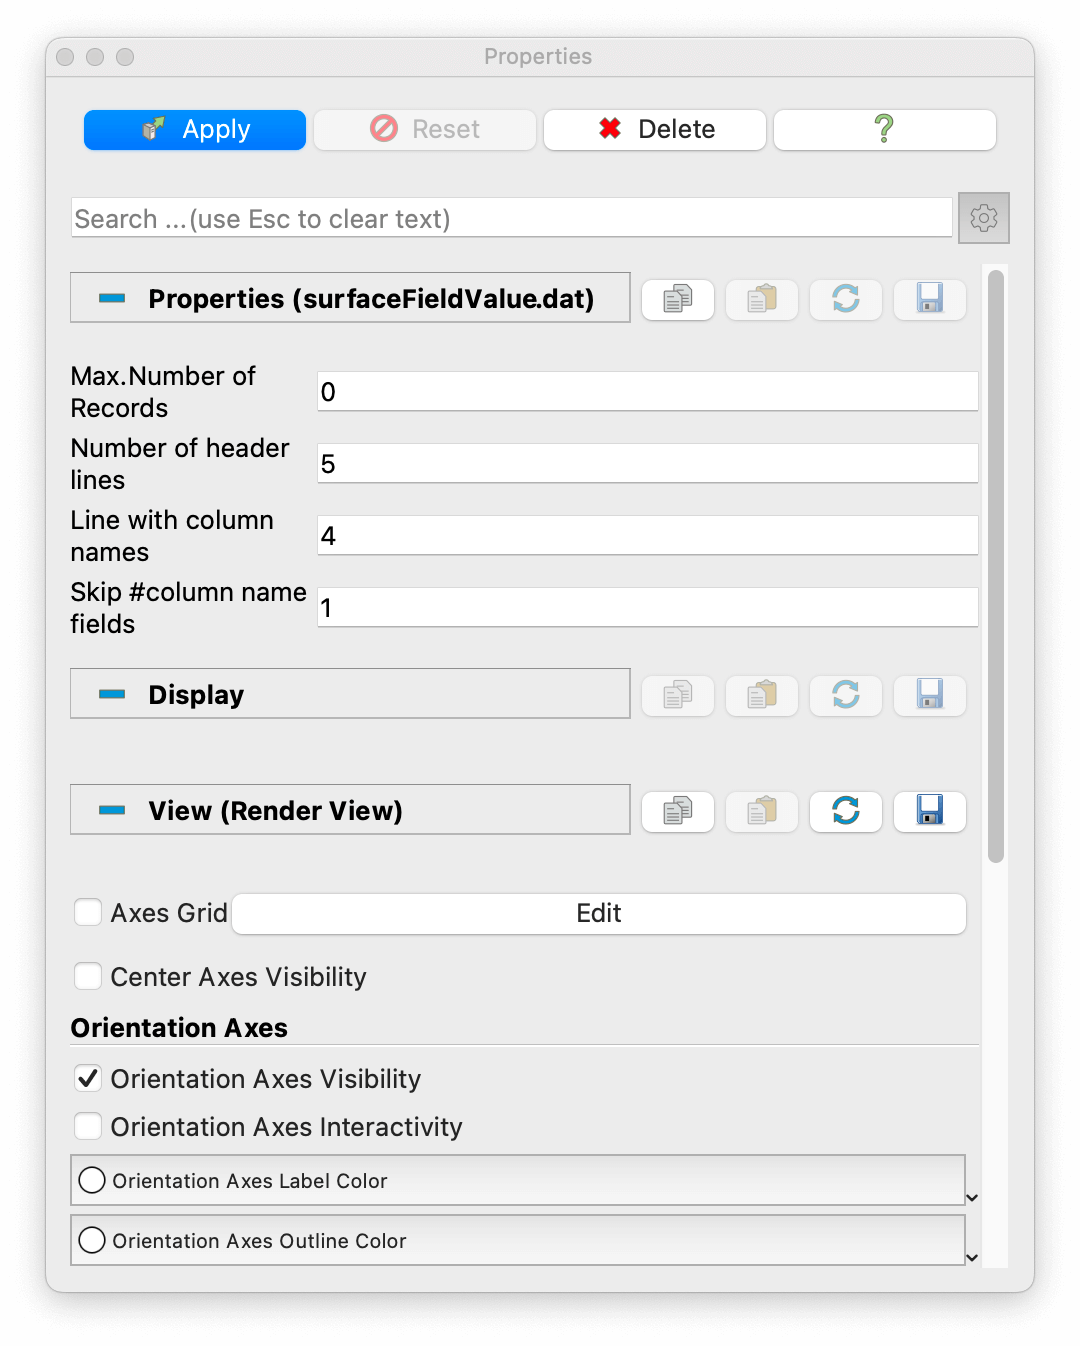
In this case (see sample of the data file above), we have:
5lines in our header (those starting with#)- our column names are on line
4(note that it’s0indexed) - we need to skip
1leading#to get the column names right
Leaving the max. number of records at 0 will read in the whole data file.

Click Apply & that should do it. Change the default spreadsheet view to a line chart view, make sure the data is visible (click the eye in the pipeline browser) & you should have yourself a line chart.
You can customise things to your hearts content – add legends and titles, turn series on/off, mess with fonts & colours etc.
You can pan & zoom around using the mouse (just like you would in 2D mode) & reset the zoom using the usual buttons.
If you want to ignore the start of the file, then just increase the number of header lines in the reader & it’ll skip that many lines.
If you’re monitoring a live run, then right-click the data in the pipeline browser & click Reload Files to re-read the data (the settings for the chart & reader are sticky – they don’t reset when you do this).
Gotchas
There’s one gotcha: it doesn’t work with vector data.
For example, if you’re monitoring a vector field or force/moment components, then the reader will trip over the parentheses in the data file 🙈
You can easily strip them out to make it compatible, just don’t do it to a live/running data file – you’ll really confuse things.
A quickie
There you go, a quick ParaView tip that might come in useful one day. The quick tip format seems to be quite popular, but if I’m wrong, let me know.
I struggle with the ParaView emails a bit, so what do you want to know? Is there anything specific I can help you with?
Let me know, I’ll add it to the list & you’ll be making these emails better for everyone 🙏
Until next week, stay safe,
