Hey there,
It’s Robin from CFD Engine & this week I’ve been chasing down a post-processing technique that’s been missing from my toolkit for years.
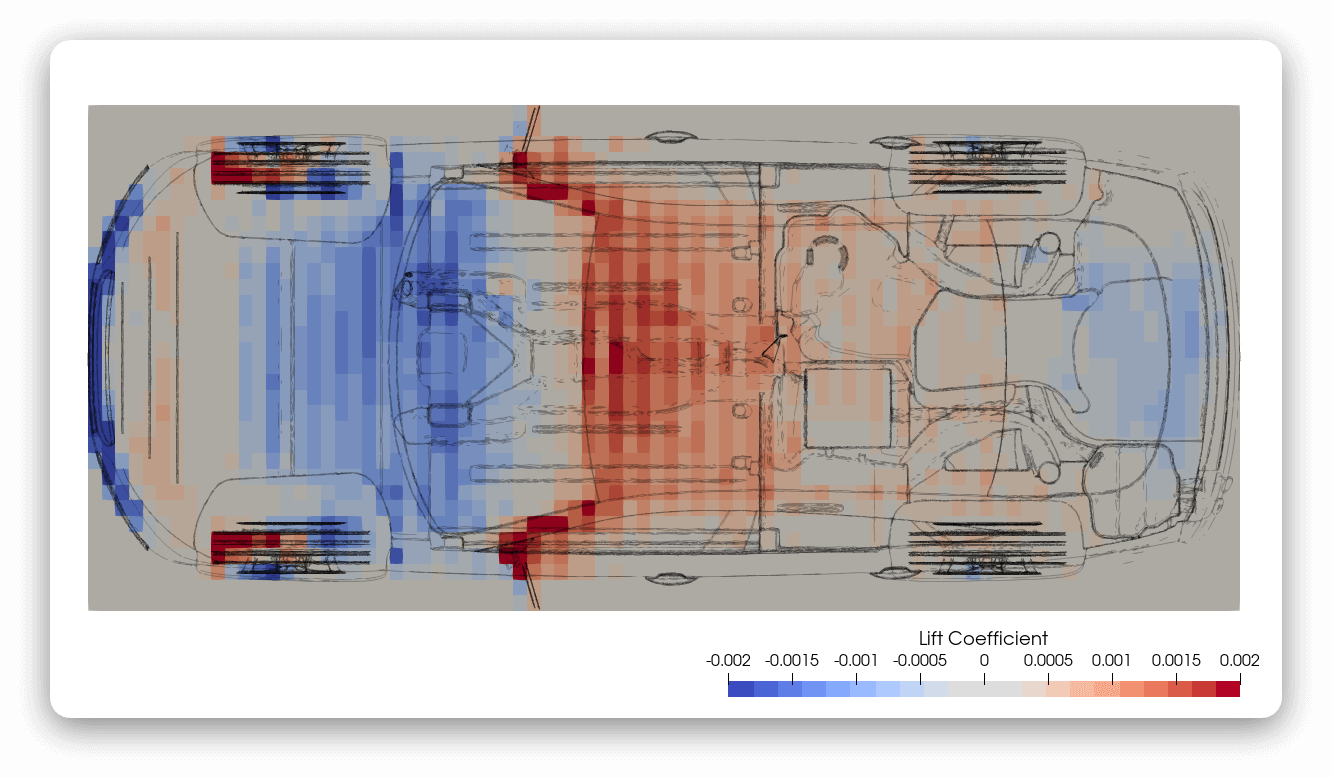
I wanted to be able to make plots like this again…

No, it’s not 8-bit post-pro drawn in MS Paint, it’s a force X-ray of the drivAer model, courtesy of OpenFOAM v2206 & the new binField function object.
It wasn’t the easiest plot to make though, so I’ll give you the general gist this week & next week I’ll give you some tips on getting the raw data into ParaView, so you can make your own (8-bit) force X-rays.
Let’s go…
Loosing the plot
I was introduced to these plots more than a decade ago, at a previous employer. We called them “force X-rays” as they allowed you to see through your model, resolving forces onto a plane & revealing their distribution.
It’s a really useful technique for visualising the spread of forces on complex geometries, especially when important bits are obscured by (or themselves obscure) other bits of the model.
To create these plots, you essentially chop your model into small sections & report the forces acting on those sections. My previous employer used an in-house code to generate these plots & hence they’ve been out of reach since I left.
But they’re back in my toolbox now 👏
My drivAer image isn’t the most exciting demonstration of the technique, but you (hopefully) get the idea. I don’t think there’s another plot type that could show the distribution of all of the significant lift/downforce generating areas in a single view.
It’s not just for plotting the lift distribution on the ground-plane either, drag on a YZ-plane or sideforce on an XY-plane could also be pretty informative, depending on your application.
New & Improved
We’ve had the ability to segment models & report the forces on those segments for a while. It was called binning & it used to live in the forceCoeffs function object. However, it only chopped the model in a single direction. Great for plotting a curve, but not for a X-ray.
That was pre-v2206 – now we have binField (not to be confused with Binfield) which extracts the binning functionality from forceCoeffs & extends it with a couple of new features.
Firstly, we’re no longer restricted to just binning forces, we could bin any field that we might plot on our model’s surfaces (I’m not sure what they’d mean, but we could do it).
Secondly, we’re no longer restricted to binning in a single direction, we can now section our object of interest along the major axes of any Cartesian (or cylindrical) co-ordinate system (this was the development that grabbed my attention).
General gist
So how do we use it?
If you want to bin forces (as I do), you first calculate them using forceCoeffs & then bin them with binField – two separate steps.
binField runs pretty quickly, has a few quirks (plus some bugs) but it seems to get the job done.
Here’s an annotated gist if you’d like to give it a try – you could use it directly with the results of the motorBike tutorial (or tweak it to fit your own data).
Be aware, the output format isn’t super-friendly, especially if you want an 8-bit masterpiece (like mine) but more on that next week.
What do you think? Have you come across this plot-type before? Do you already use X-rays? Do you think this might be a useful addition to your toolkit? Or should we just drop the whole thing in the bin 😉
Drop me a note, I’m always keen to hear your thoughts.
I’ll be back next week with a hack to plot this data in ParaView.
Until then, stay safe,
