Hey there,
It’s Robin from CFD Engine & this is one of those emails that’s really just a glorified note-to-self. Every so often I need to find the difference of two results in ParaView & it takes me 20mins to remember how to do it 🤦♂️
So, having just done it again, I thought I’d use those 20mins wisely & note it down for my future me.
I’ll keep it short & sweet – I’m just talking about comparing results that use the same mesh and doing it in ParaView.
I’ve written about comparing results from different meshes in OpenFOAM before & I’ll save how to do that in ParaView for another day.
For context…
Let’s say you have the results of two simulations that were done using the same mesh (perhaps a different flow rate / time step / yaw angle / turbulence model / solver scheme - that sort of thing) & you’re interested in plotting the difference between the solutions.
Here’s how to do it in ParaView…
Read in your data
You know how to do this 💪
Rename your fields (optional)
Do yourself a favour & rename the field(s) of interest in at least one of your datasets. Then, when it comes to calculating the difference, you’ll be sure which field comes from which solution.
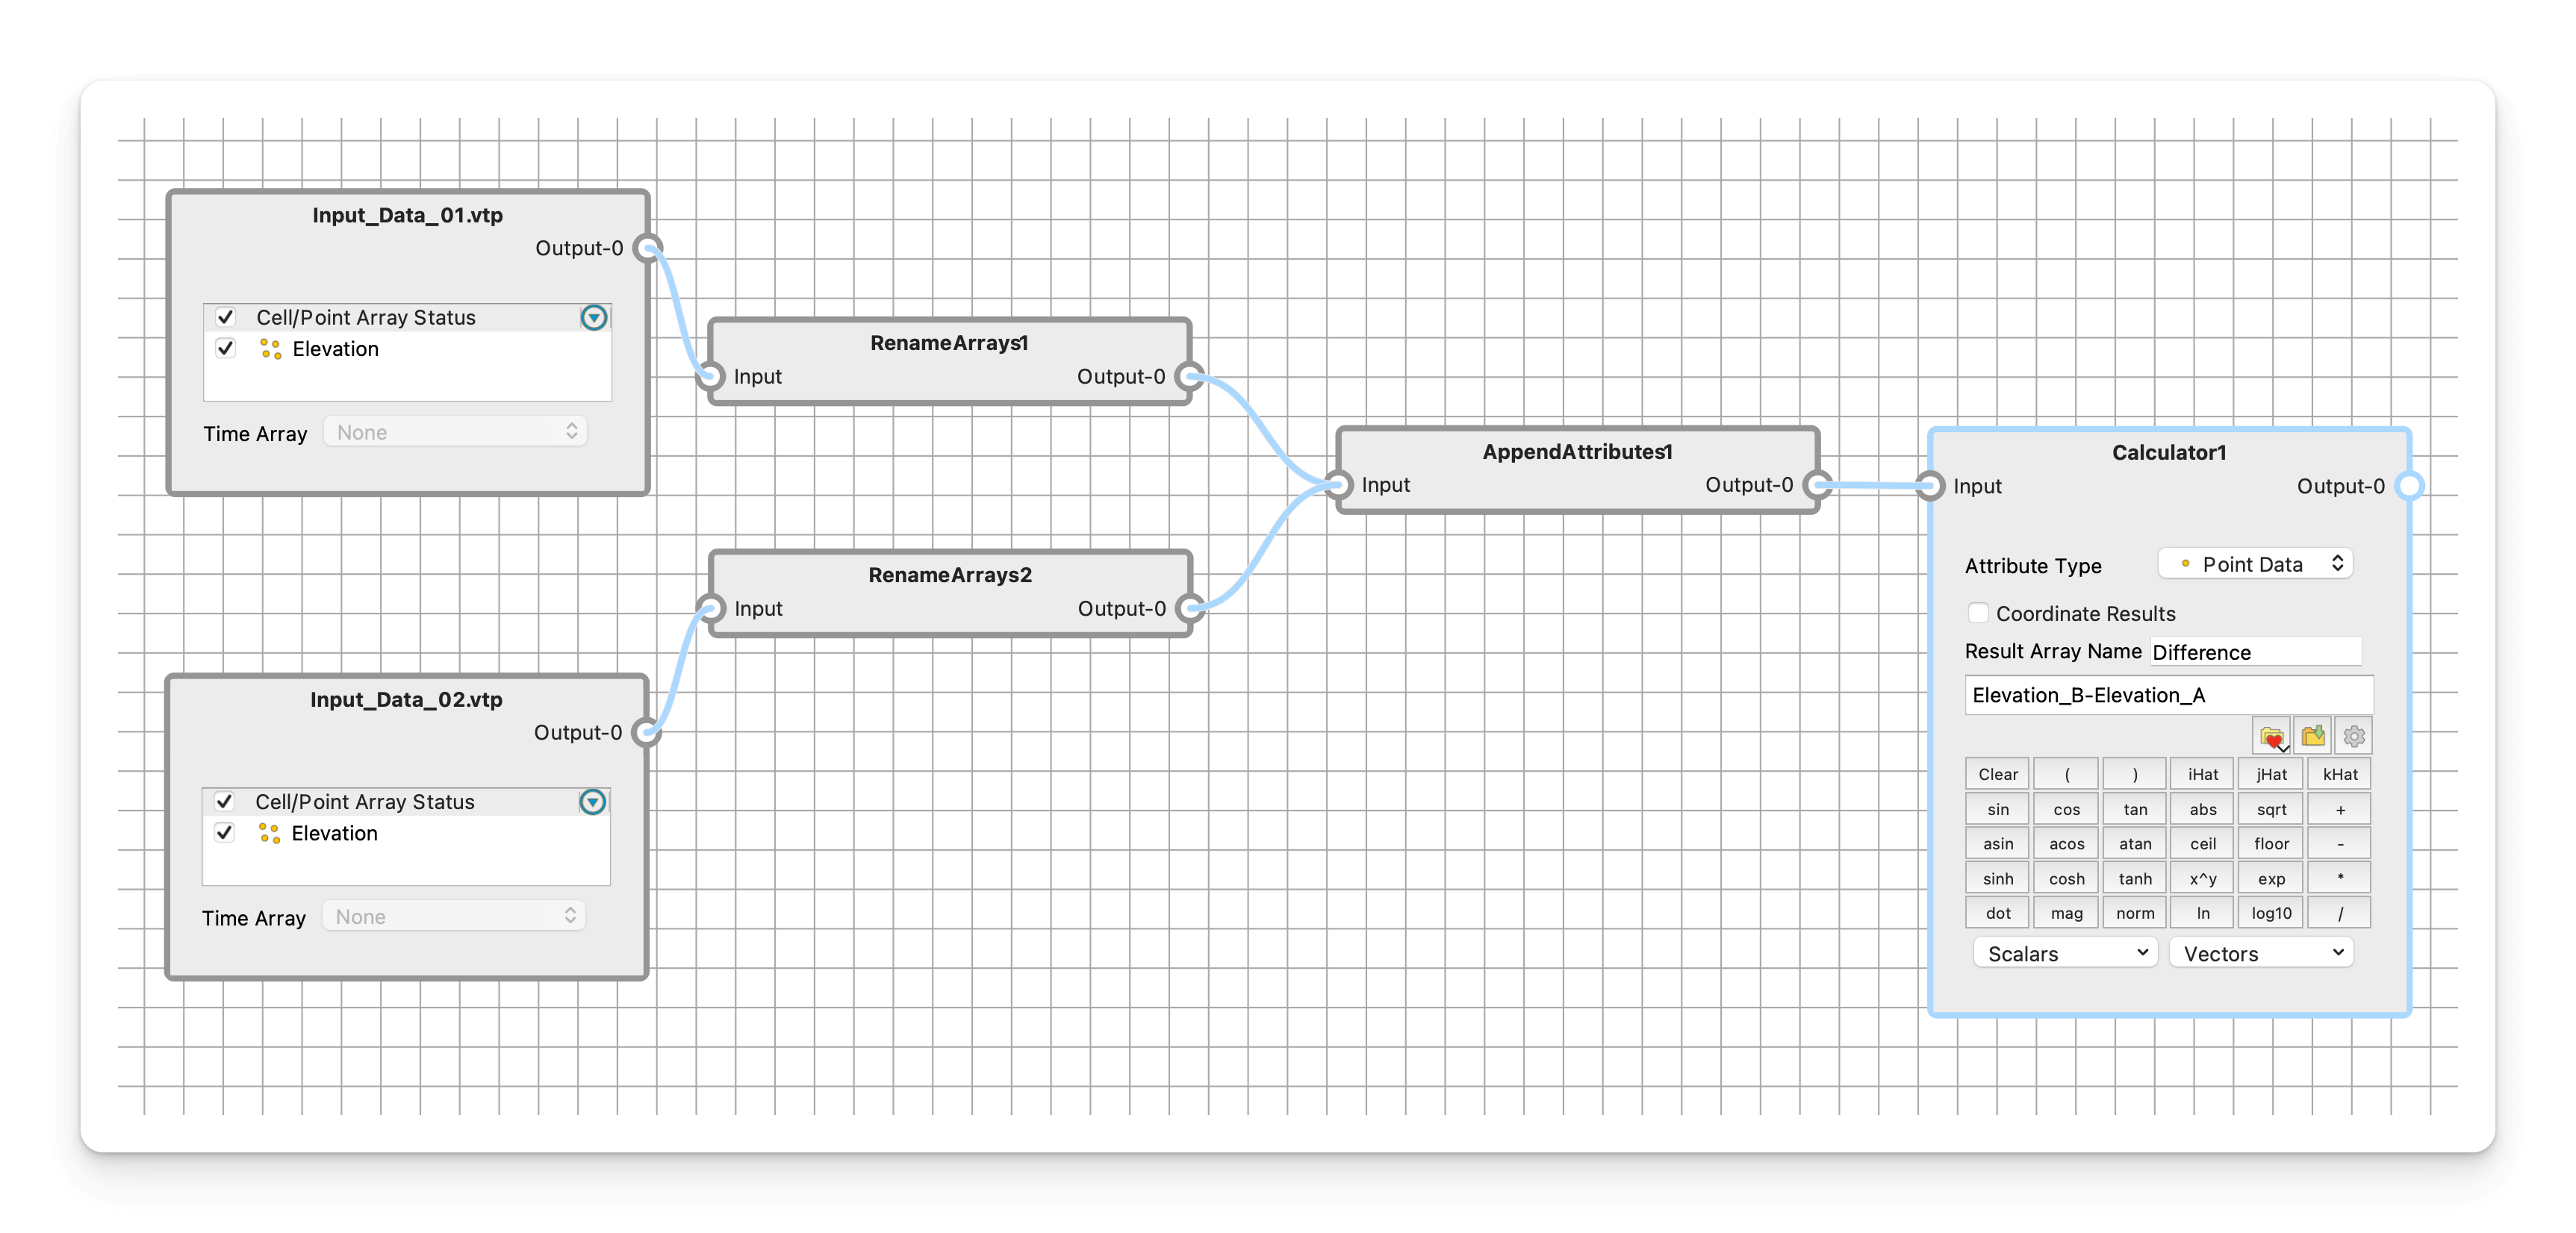
If you’re using the most recent ParaView (v5.11) then you can just use the Rename Arrays filter.
Otherwise you can get the same effect using the Calculator filter to create a new field from an existing one and give it a new name.
Now is also a good time to use the Pass Arrays filter to remove any fields you’re not interested in.
Combine the results
This is the bit I always forget, you’re looking for the Append Attributes filter (there are several Append ... filters, but this is the one for this job).
Select your first dataset from the pipeline, shift/cmd-click to select the second dataset & choose Append Attributes from the list of Filters.
If you’re using a recent(ish) ParaView, it will automatically append _input_N to any fields whose names clash – this is why the renaming step was optional.
The names depend on the order you clicked the datasets (the first one doesn’t change name) – this is why the renaming step was recommended 😜
You can also do more than just two datasets if you’d like, just keep shift/cmd-clicking to add more, before selecting the Append Attributes filter.
Calculate the difference
Nothing special here, just add a Calculator filter to the Append Attributes result & take one field away away from another.
Plot the difference
Nothing special here either, although using a diverging colour map (like the standard cool-to-warm map) centred about zero can be good way to highlight the areas that have increased, decreased, or haven’t changed.
Celebrate 🎉
That’s it – you’re done.
Here’s how it looks in the node editor (click for a bigger version)…

Simples
There you have it – a quick note on plotting the difference between two solutions that share a mesh, in ParaView.
This is something I usually do on surface data, as opposed to the whole domain, but if you have memory to spare, & can read-in two (or more) volume meshes, then go for it (it might take a while though).
At the opposite end of the spectrum, I’ve even used this on images. It will only show you where things have changed & you won’t (easily) be able to extract the magnitude or direction of those changes, but it works surprisingly well 👏
Was this useful? Too simple? Is there a better way? Let me know what you reckon, so that I can pitch future emails at the right level.
Until next week, stay safe,
