Hey there,
It’s Robin from CFD Engine & if you’ve ever had to re-do an image (or a series of images) because you forgot to update an annotation 🤦♂️ then this email’s for you.
It’s a quick introduction to ParaView’s Python Annotation filter, a neat (but not new) way to create dynamic annotations that are always up to date.
So, whether you’re looking to annotate a property in an animation, or you want a label that’s synced to your current dataset, then this filter has you covered.
Let’s get into it & then you can go and give it a try…
Python Annotation
There are a bunch of ways to annotate your scene in ParaView, from a simple text source, all the way up to “beast-mode” a.k.a. the Programmable Annotation 💪
The Python Annotation sits somewhere in-between, blessing us with a single line of Python code to create our annotation.
With that one line we can grab data from our model, do all manner of calculations, combine it with other strings & format it to our liking, before writing the output into the scene as a regular text object.
It updates whenever the data or the time step change, so we can set it & forget it, confident that it will always be up-to-date.
Note: If you must use more than a single line of code (&/or you want to use some external Python modules) then you should check out the raw scripting power of the Programmable Annotation instead.
That said, we can do a lot with one line, here’s a simple example…
Location annotation for an animation
I love a slice movie 💛 one of the least-exciting (but most informative) post-pro techniques that you’ll ever use.
Sweeping a planar slice (coloured by an interesting field) through your domain, is a great way to figure out what’s going on inside the flow.
I make X, Y & Z-normal slice movies of static & total pressure coefficient, for every simulation I run. My preference is to export the slices from OpenFOAM (using the sample function object) & then use ParaView to create the images (it really flies when it doesn’t have to do the actual slicing).
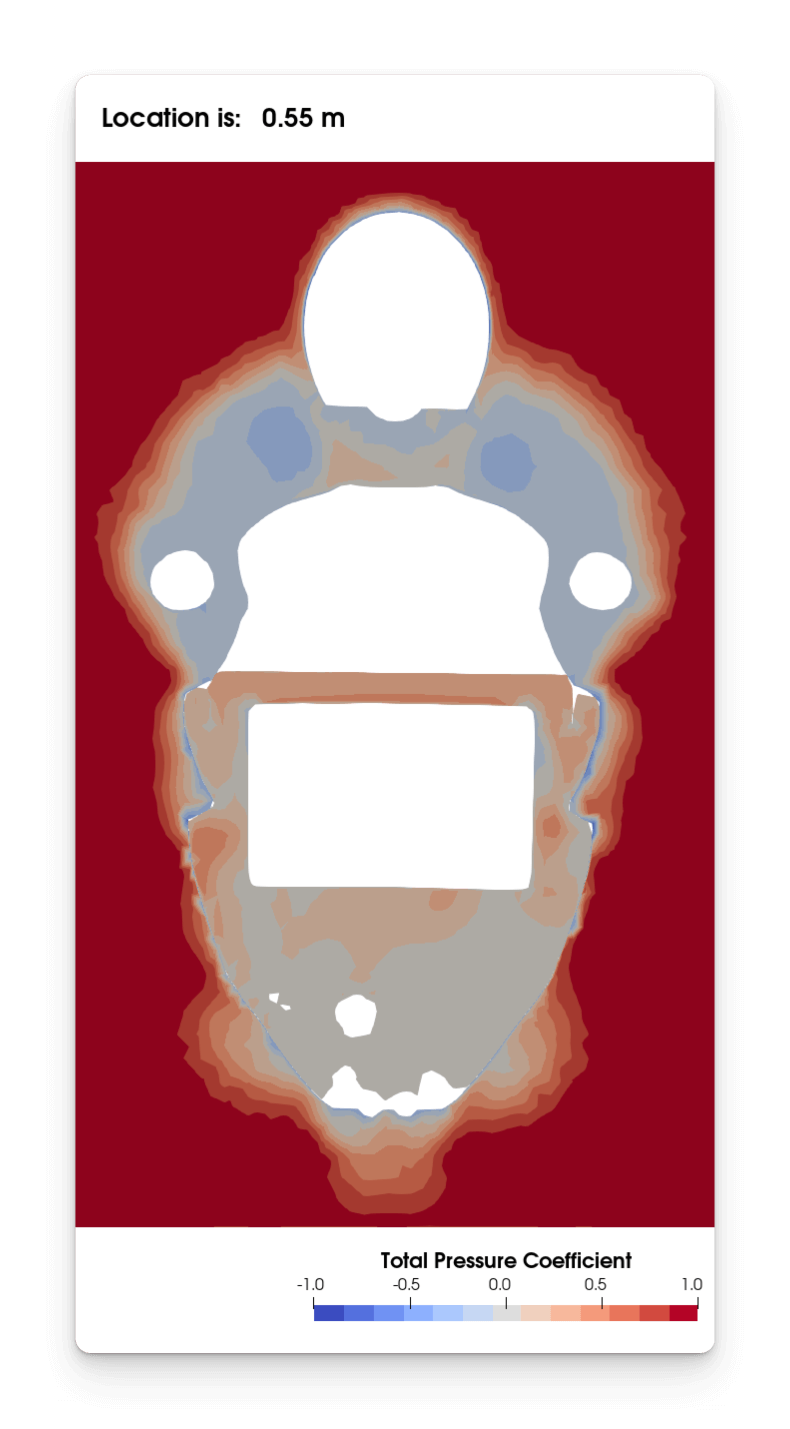
I use a Python Annotation to query the location of the slice from its co-ordinates, then I format it nicely, add some extra text & display it in the scene.
You can see it at the top of this example, using some questionable data from the motorBike tutorial 🙈

The one-liner I used in my Python Annotation was:
"Location is: % 6.2f m" % inputs[0].Points[0,0]
where:
inputs[0]refers to the object that the filter was applied to (in this case, my slice plane);Points[0,0]grabs the X-coordinate of its first data point;- whereas
Points[0,1]would grab the Y-coordinate &Points[0,2]would grab the Z-coordinate;
- whereas
- The
"Location is % 6.2f m"bit is just some old-style string formatting to print the co-ordinate value (to two decimal places, with space for a minus sign) plus the additional text.
You might need a more complex function, especially if your slice doesn’t have a constant X, Y or Z co-ordinate, but you get the idea 😊
Give it a go?
This is a neat little automation that could be used in all sorts of scenarios.
For example, you could use it to report the maximum depth in a multiphase simulation, or the mean temperature of a component in a heat transfer case. You could even use it to record flow parameters such as windspeed, or yaw angle, on your images – anything goes really.
Check out the documentation for more details but, with the power of Python & the functions from the Python Calculator at your disposal, you should be able to do much better than my little example 😉
Do you already use the Python Annotation filter? What do you use it for? Any cool one-liners that you’d like to share?
If it’s new to you, do you think you’ll give it a try? What would you like to dynamically annotate?
Drop me a note, I’m keen to hear if this is (or will become) a useful part of your post-processing.
Until next week, stay safe,
