Hey there 👋
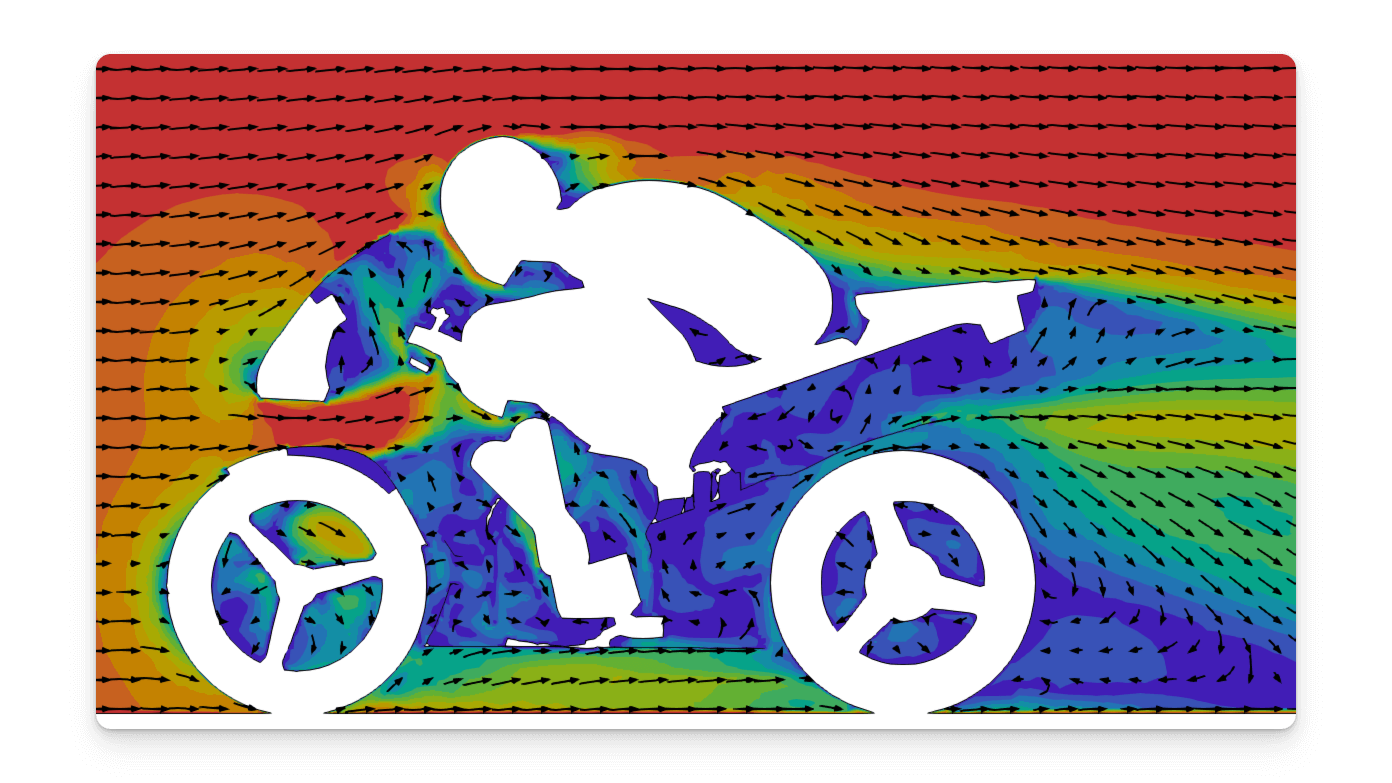
It’s Robin from CFD Engine & we’re making plots like this today 👇

Specifically, nicely-spaced, in-plane vectors with curved & scaled tails, that can be a useful overlay for contour plots.
Use the vectors to show what’s happening in-plane, and the contours to show what’s happening out-of-plane (unlike in my plot, which is just meant to look nice).
They also lend themselves to animation – sweep your plane through the flow field & watch the vectors swirl around in a very satisfying way.
Yes, we could use LIC, but options are always good, so here’s how to make curvy vector plots in ParaView.
Alternatively, if you just want nicely-spaced, regular vectors, then I’ve got that too – keep reading…
An oldie
I’m showing my age, but plots like this used to be everywhere. I don’t see them (or make them) much any more, but the response to my recent LinkedIn post convinced me that they’re still worth having in your toolkit.
There’s a bit of fakery going on here though. These aren’t really arrows, they’re short streamlines, reversed-traced from a grid of points, with a cone glyph on top to make them look like arrows.
They’re not a one-click solution, but they are super-customisable & can be made to suit lots of different flows.
You may not have a need for them, but knowing how to make them could be useful when you’re developing your own post-pro methods.
The steps
This is how it plays out in ParaView…
- Take a
Slicethrough your data; - Apply the
Surface Vectorsfilter to remove the out-of-plane component; - Create a grid of points using a
Planesource, make it co-planar with your slice; - Create the vector tails by reverse-tracing short streamlines using the
Stream Tracer from Custom Sourcefilter, use theSurface Vectorsas input & yourPlaneas the seed. - To create the vector heads
Clipthe stream traces by integration time (use a small negative value as they’re reverse traced) & display them as 3D Glyphs (or use theGlyphfilter). - Spend the rest of the day tweaking the settings to get things looking nice 🤩
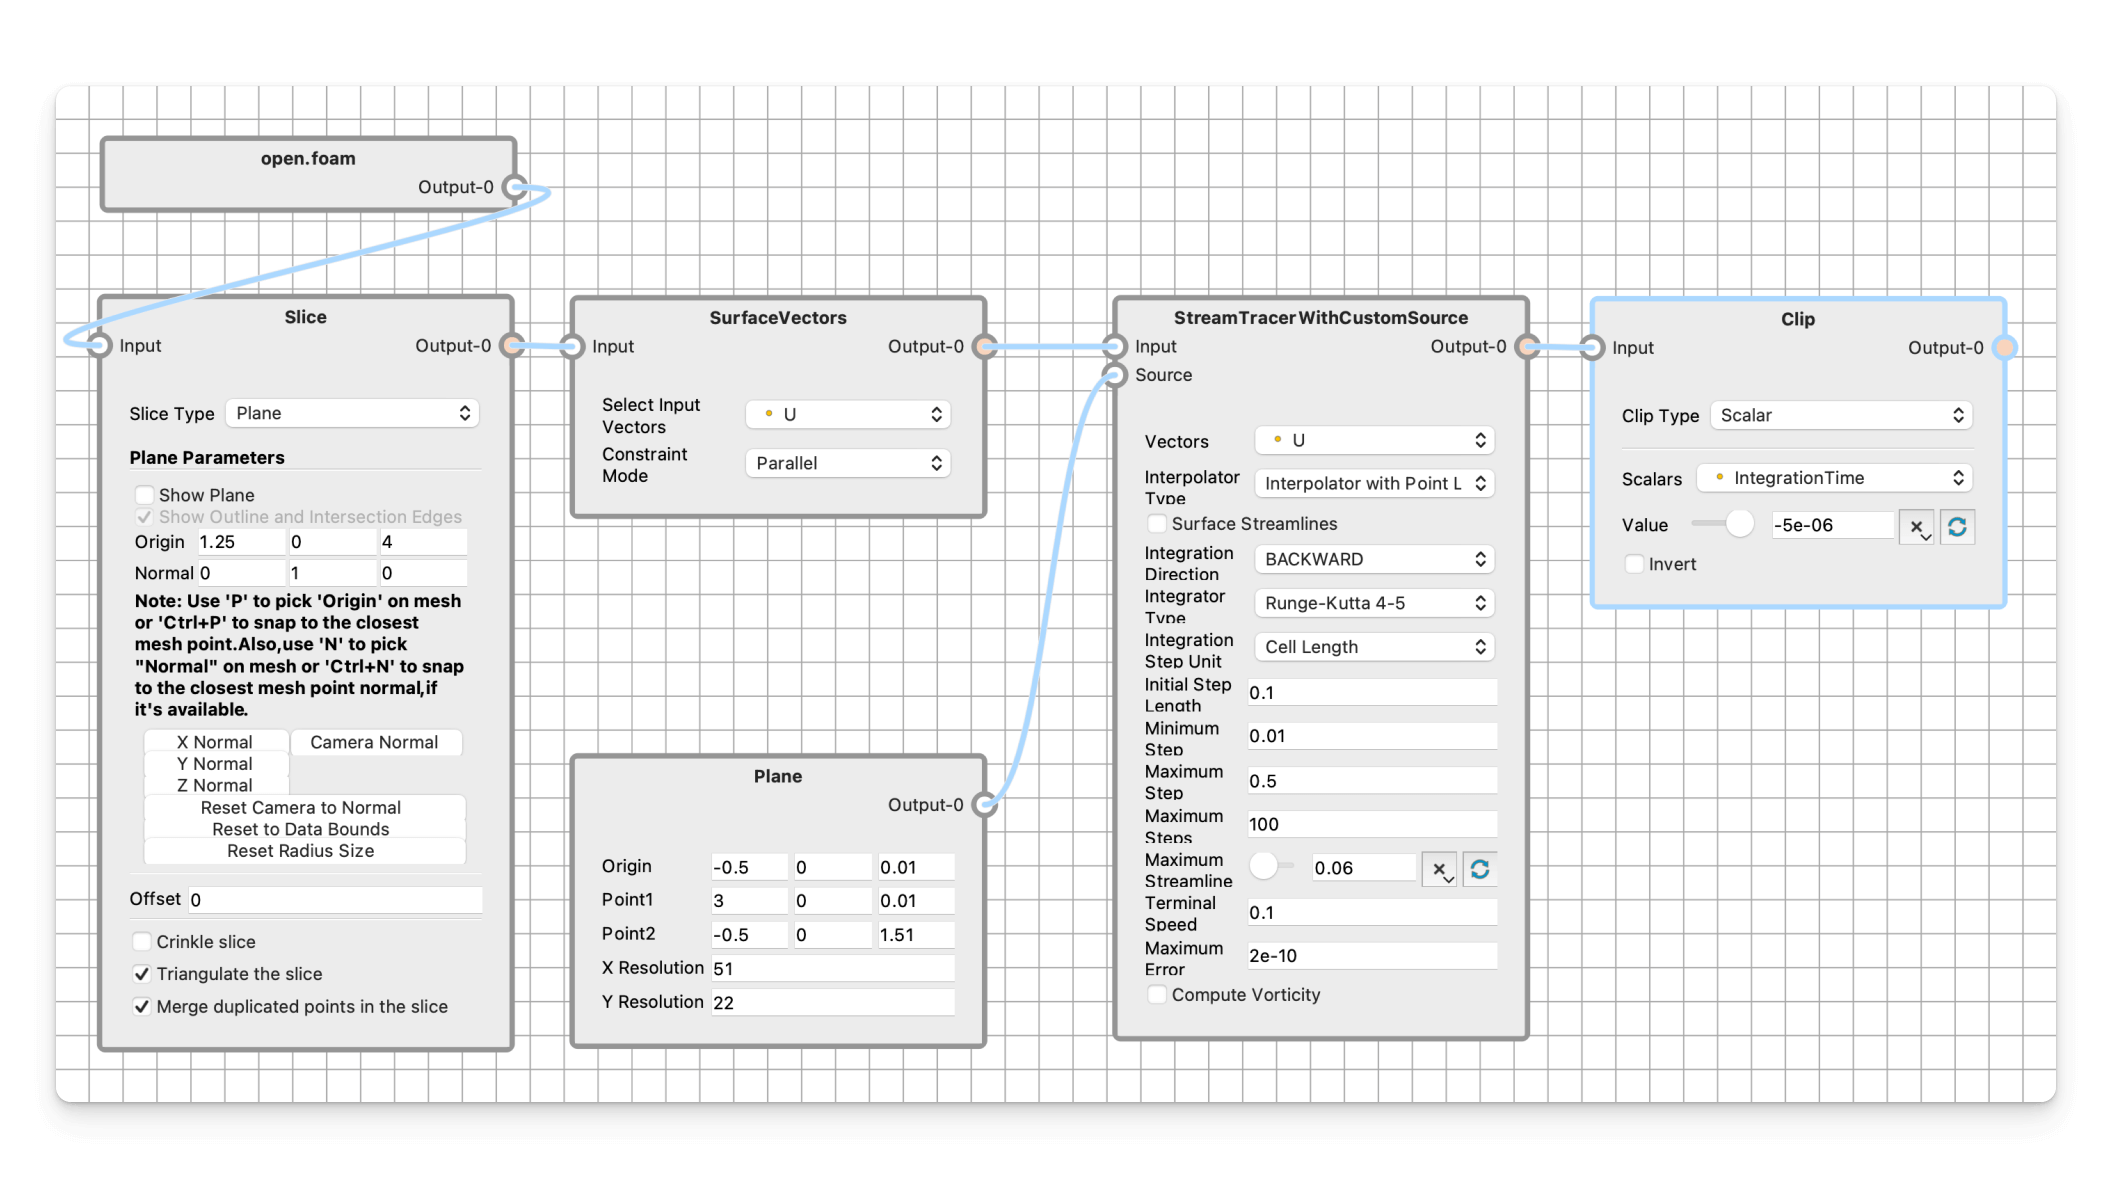
Here’s a node network that describes the pipeline & shows my settings (click to enlarge). You don’t need to use the node editor to build it, this is just a nice way to show the pipeline & most of the settings.

Some notes
You’ll definitely need to tweak the streamline parameters, the three most useful ones are:
Maximum Error: reduce this if the streamlines are too long in slow areas;Maximum Streamline Length: set this lower than your grid spacing to stop your streamlines running into each other;Terminal Speed: use this to cull streamlines from dead areas by setting it to a low (for your flow) value;
If you want to display your vectors in white (if you’re using a dark colourmap) then you’ll need to tweak their lighting parameters to hide the 3D-ness of the cone. Just turn their Ambient lighting up to full & you should be good 👍
Regular Vectors
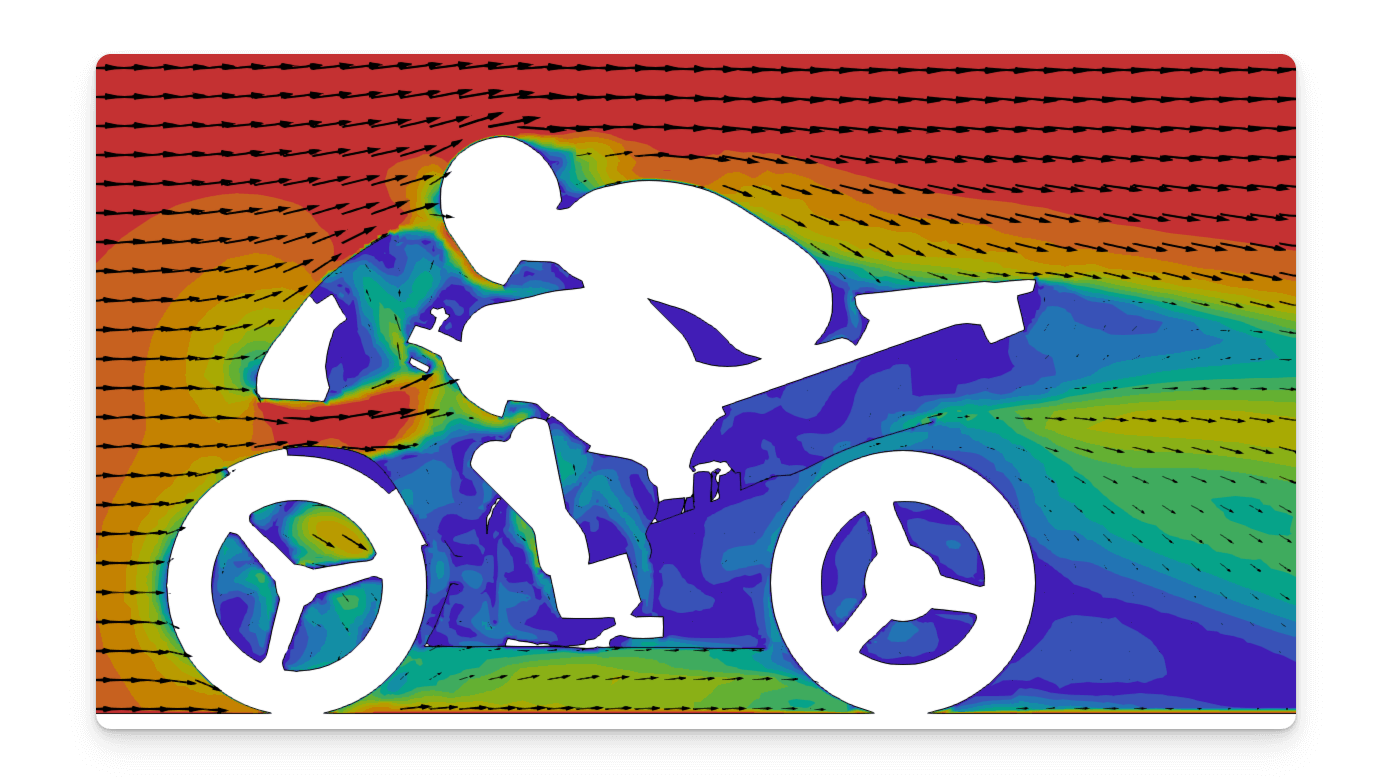
If you want to put regular arrow glyphs on an evenly-spaced grid then you can skip a few steps.
Make your Slice, apply the Surface Vectors filter & make your Plane grid (all as before) but then use the Resample with Dataset filter to get vector data at your grid points.
Set the Surface Vectors to be its source data array & the grid plane as its destination mesh & make sure you’ve got Mark Blank Points and Cells ticked.
Display the result as 3D glyphs, tweak the size, scale & orientation & you should get something like this 👇

Useful?
This was a bit of an exercise in “ParaView Thinking” – you know what you want, but how do you do it in ParaView?
You might use the vectors, you might not, but I hope it’s useful to see how it’s done & that it feeds into your own post-pro methods.
Let me know if you use this, if you have any problems with it, or if there’s something else you’d like to know how to do 🤔 my inbox is always open.
Until next week, stay safe,
