Hey there 👋
It’s Robin from CFD Engine & this is one of those emails where I sketch something & you tell me if it’s bonkers.
In this case it’s a way to compare two simulations that takes the best bits of delta plots (i.e a quick indication of what has changed in the flow & where it happened) & leaves the expensive bits (like storing big case files & mapping them onto one another).
It’s fast, it doesn’t need much RAM & it could run on pretty much any hardware.
Sound interesting? Read on…
Delta what?
Imagine the scene: you’ve changed some geometry & run a new simulation. Instead of just showing the new data, why not subtract the original dataset & plot the difference between the two?
That’s what I mean by a delta plot.
They’re typically intuitive, informative plots that can save you from endlessly flicking between image pairs & playing spot-the-difference.
Problem is, they can be quite expensive to make.
You’ll need a machine with enough RAM to read-in two cases. If those cases have different meshes, you’ll need to map one onto the other 🐢 Plus you’ll need to have all your old cases on hand, just in case they’re needed for a delta.
Could we do any better?
If we’re already creating standard post-pro for each case, could we augment that process to make it easier to create delta plots?
Here’s what I came up with…
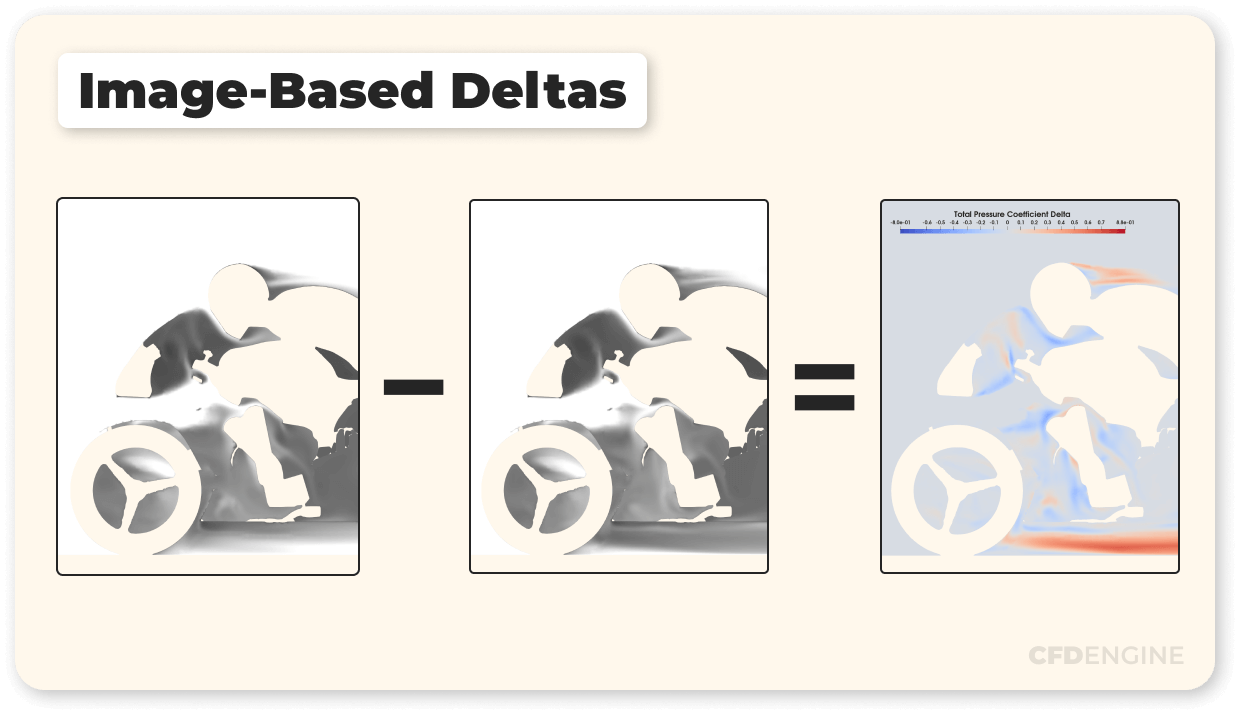
Image-Based Deltas

Stage One:
Create a new set of images that use a greyscale colour-map (& add them to your standard post-pro). This is the bit that will let us switch from pixel values to flowfield values later on.
Let white represent your highest field values & black the lowest ones.
Save your new images as PNGs & use a transparent background so that we can separate it out later.
You can include the colour-map legend in the image (if you like) or you could embed the range, the min & the max in the image’s metadata. It’s up to you, but you’ll need these values in the next stage 👇
Stage Two:
To create the deltas…
- Read images from two different simulations into ParaView;
- Scale the pixel values back to their original field values (Cp, Umag etc) using their original colour-map range;
- Subtract the images to find the difference (see here for a hint);
- Plot the result using your favourite colour-map;
- Save your new delta plot 👍
FYI: PNG data is stored as a 4D array where the first three components are the RGB values (all equal in a greyscale image) & the fourth component is the alpha (or transparency) value.
If you want to remove the background you can threshold/clip using that fourth component of PNGData, but it’s not essential.
Problems
We’re relying on pixel values to accurately represent our field data & therefore we’ll need to be wary of a couple of things:
- Lighting: Anything that changes the appearance of a surface (ambient lighting, shadows, materials etc) will affect our results. Turn the light kit off for more accurate results.
- Dynamic Range: We only have 256 greyscale levels to play with, so the minimum change we’ll pick up is one-256th of your colour-map range. Don’t make your range too big.
Over to you
There you have it, an overview of how you could add delta plots to your standard post-pro, with just a few greyscale images.
I’ve been noodling on this process for a while, but does it make any sense to you?
Is it something you might use? Would it make a useful addition to your post-pro? Do you want more info? Or is it bonkers?
Keen to hear what you reckon, especially if you give it a go & even more so if you’ve been using it for a while – drop me a note & let me know 👍
Until next week, stay safe,
